Unified channel reporting
Google Ads, Meta, TikTok, DV360, CM360, Reddit, LinkedIn, Apple Search Ads, Bing and Twitter are pulled into one reporting layer with a shared spend, conversion and revenue contract.
Reporting and creative intelligence for teams spending anywhere from $10k to millions per month on ads. Built from managing $100M+ in spend.
No calls, no onboarding queue. Pay, connect, see your data.
Or open the interactive demo with anonymised data — no signup.
Selected brands we manage
Trusted by teams running $10k to $1M+ per month across Google, Meta, Reddit and more.
Perlas GO
Mobile App · Utility payments
UNIPARK
Mobility · Smart parking
Sender.net
SaaS · Email marketing
ESET
B2B · Cybersecurity
Tinggly
Ecommerce · Experience gifts
Spark
Mobility · EV car-sharing
Proxy-Cheap
SaaS · Proxy infrastructure
DIDWW
Telecom · VoIP & SMS
The platform
Every dashboard below is a live screenshot from the demo workspace — same product, anonymised numbers.
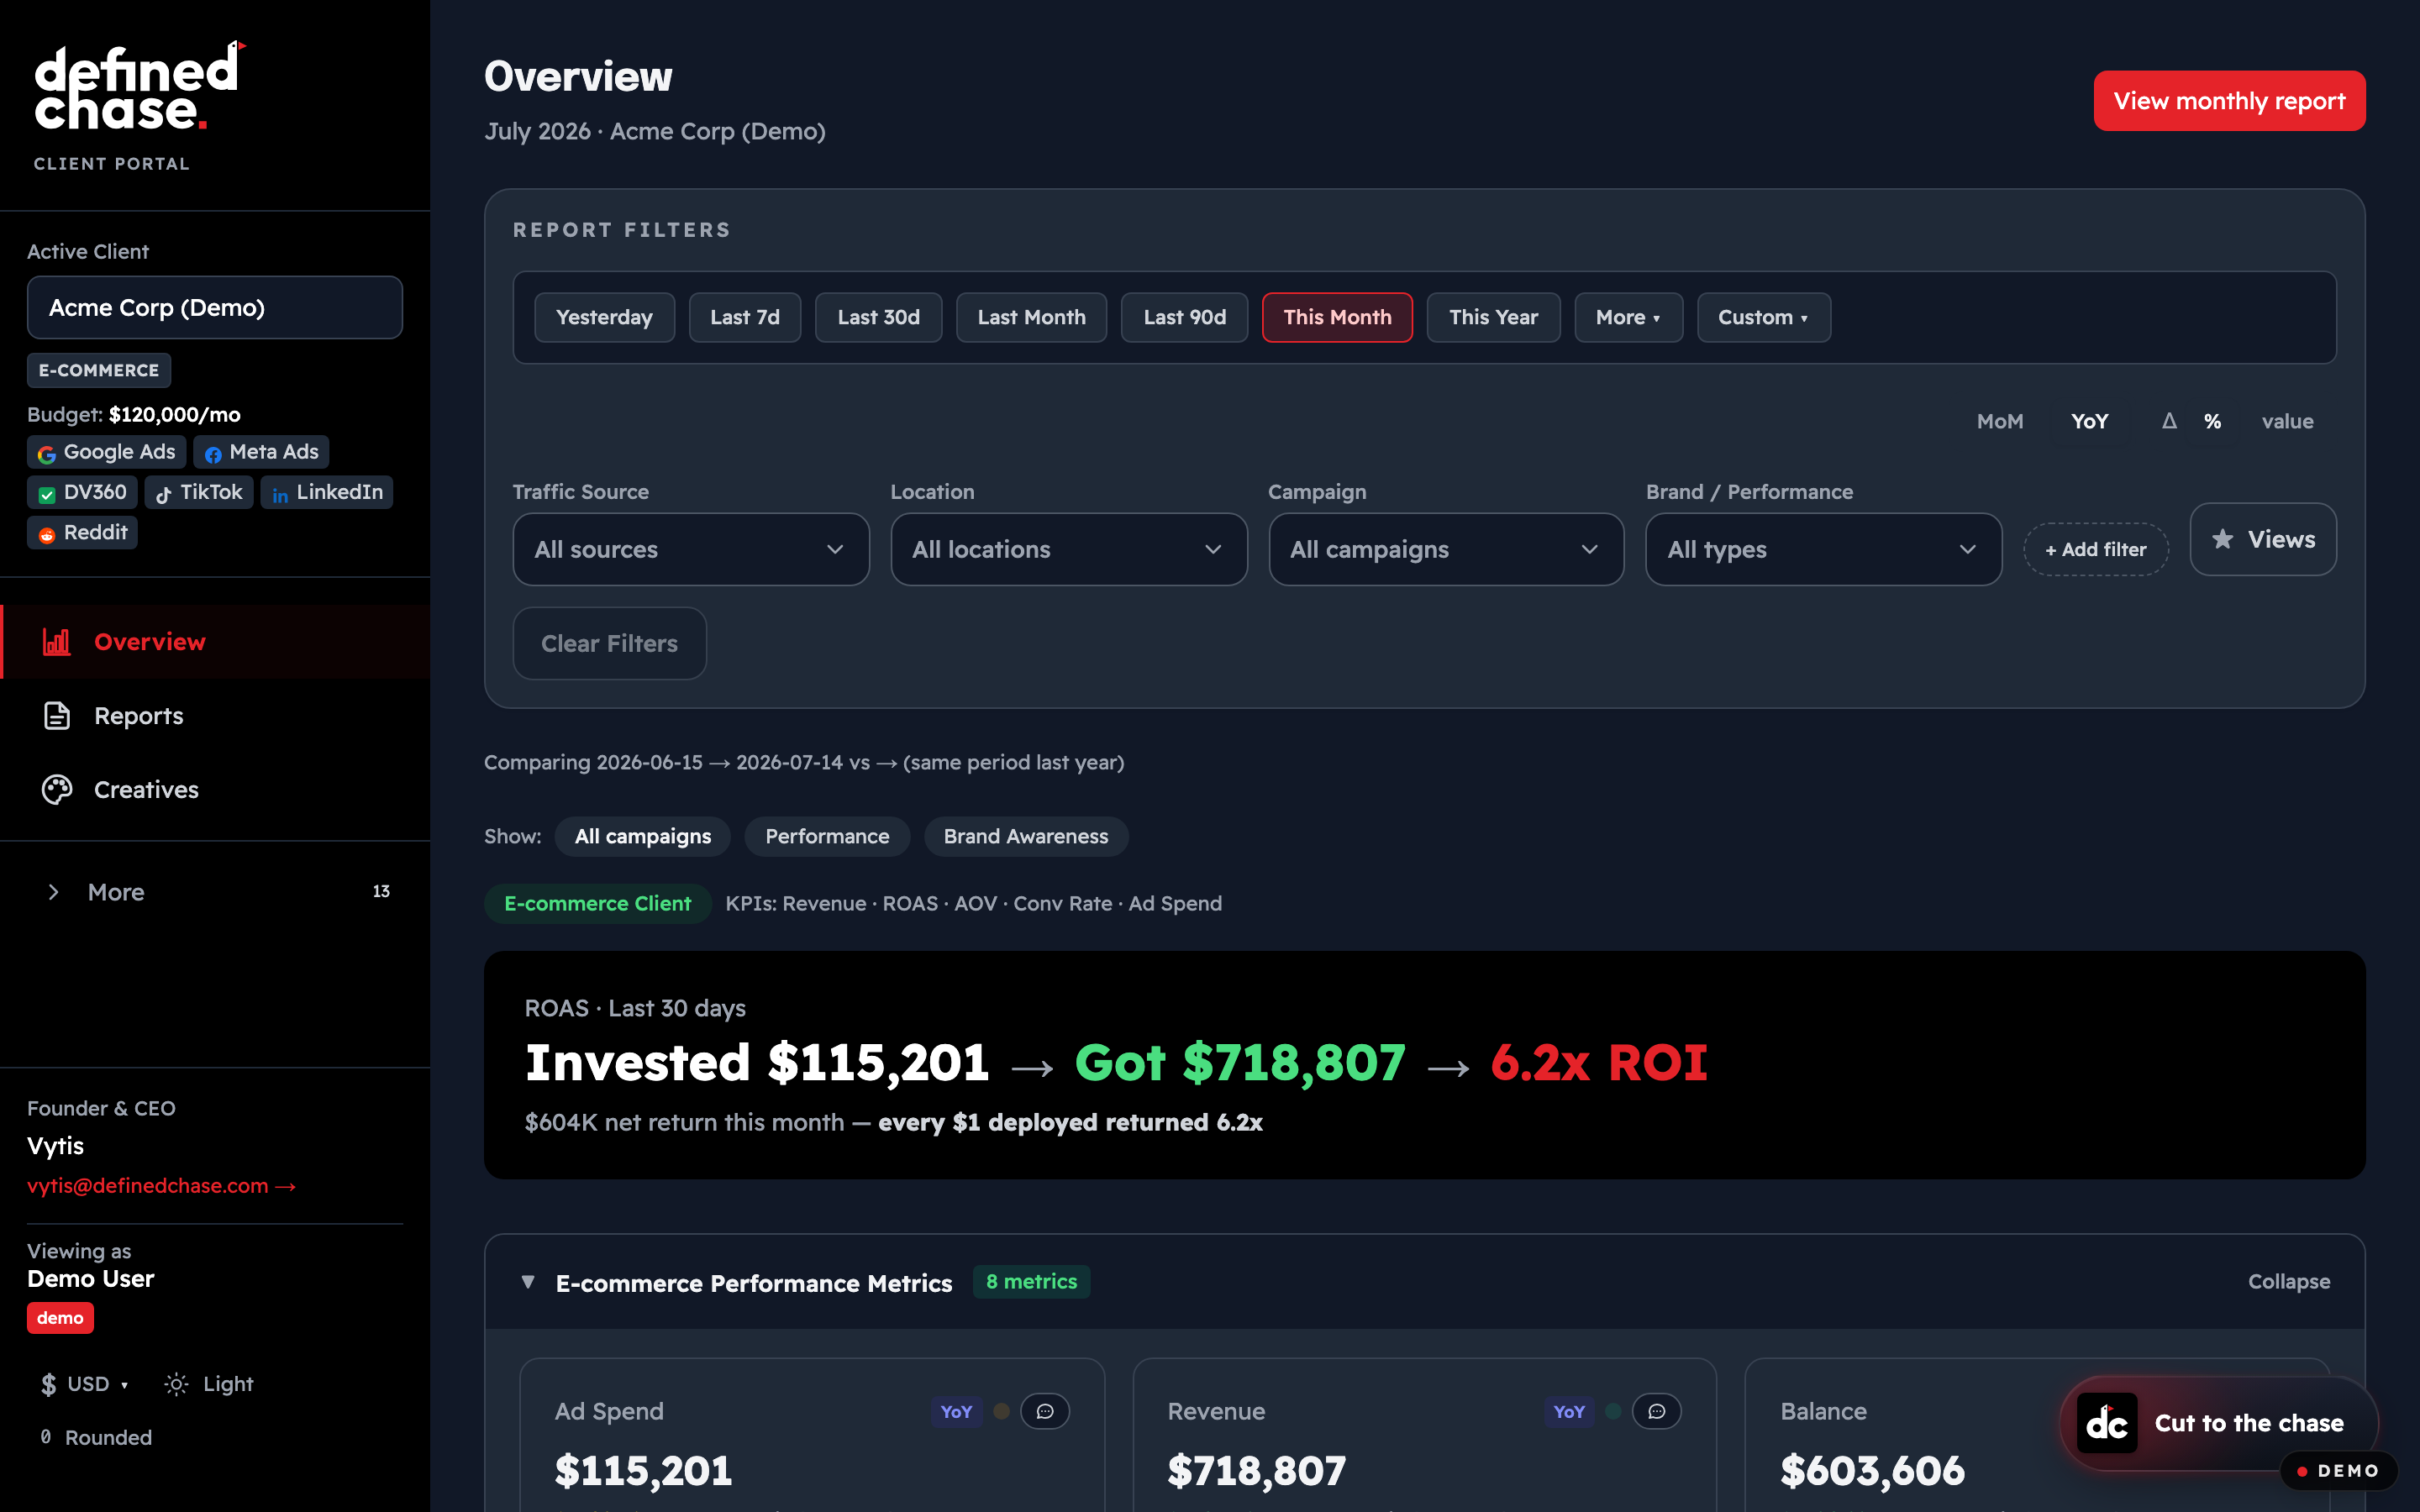
The client opens one account overview instead of a folder of static reports: spend, revenue, balance, ROAS, conversions, CPA and period deltas are visible in the same executive frame.
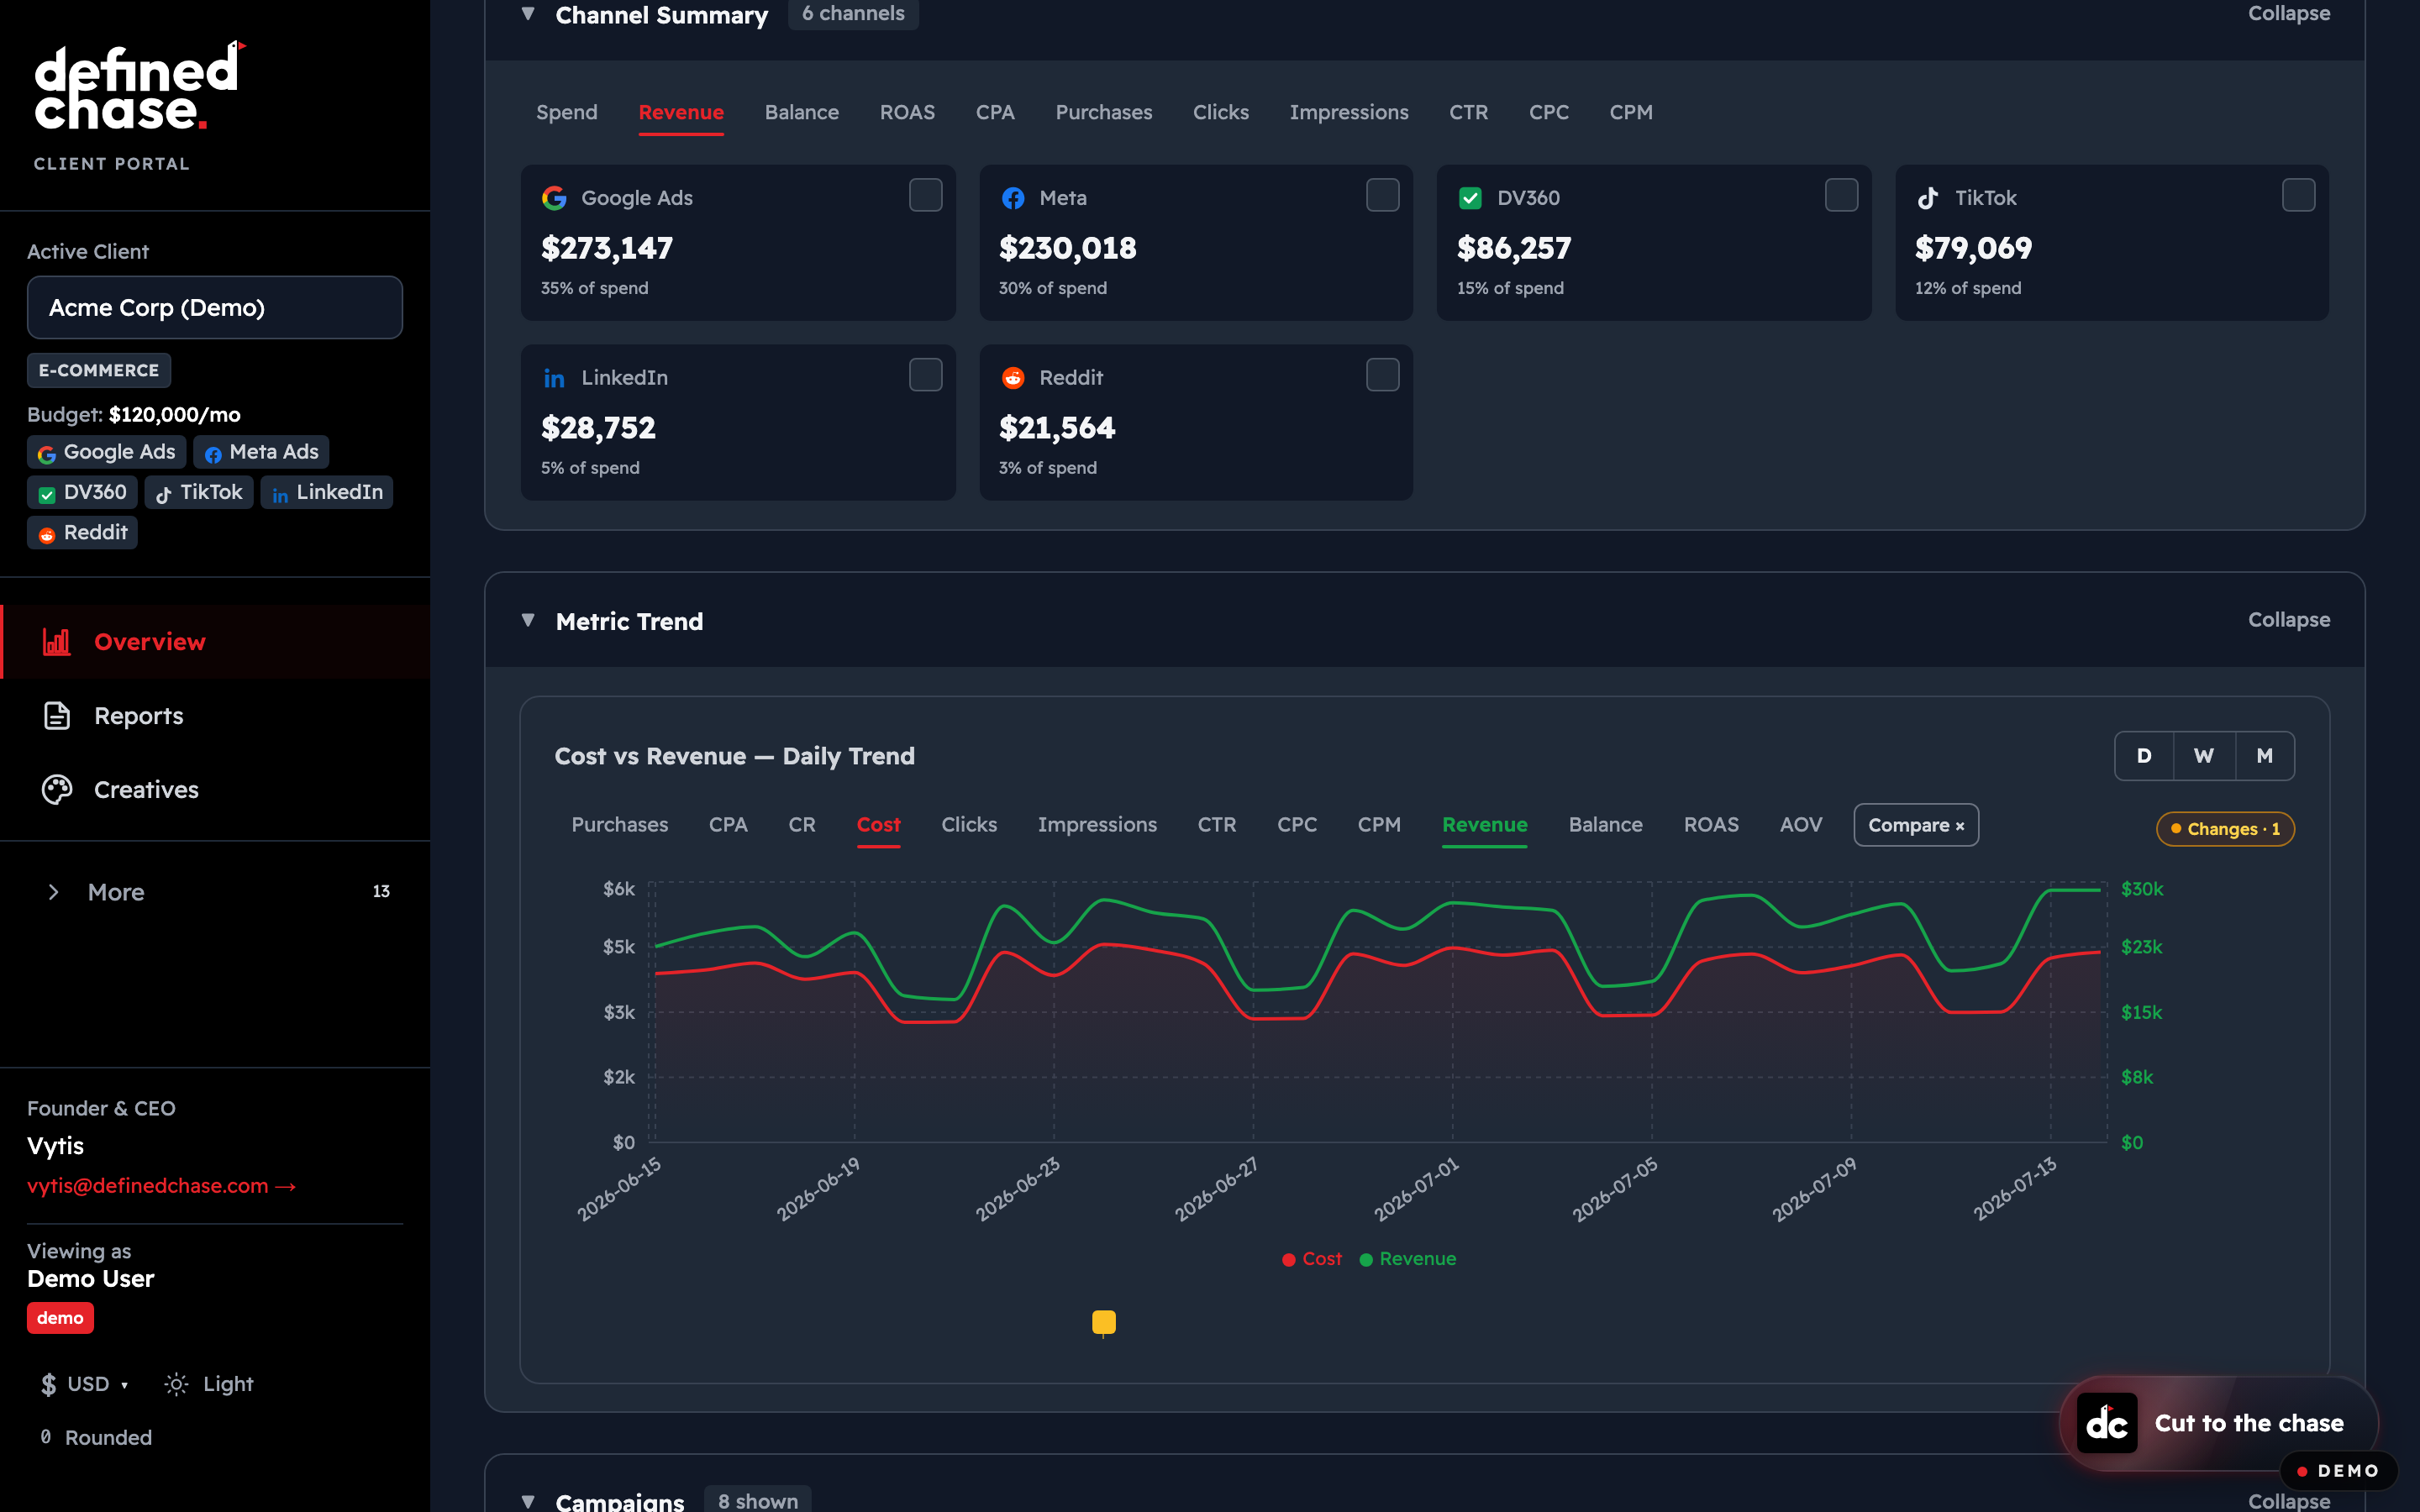
Overlay any two metrics — cost, revenue, CPA, ROAS, CTR, AOV and more — on one daily timeline. See the exact day revenue decoupled from spend and act on it, with account changes annotated right on the chart.
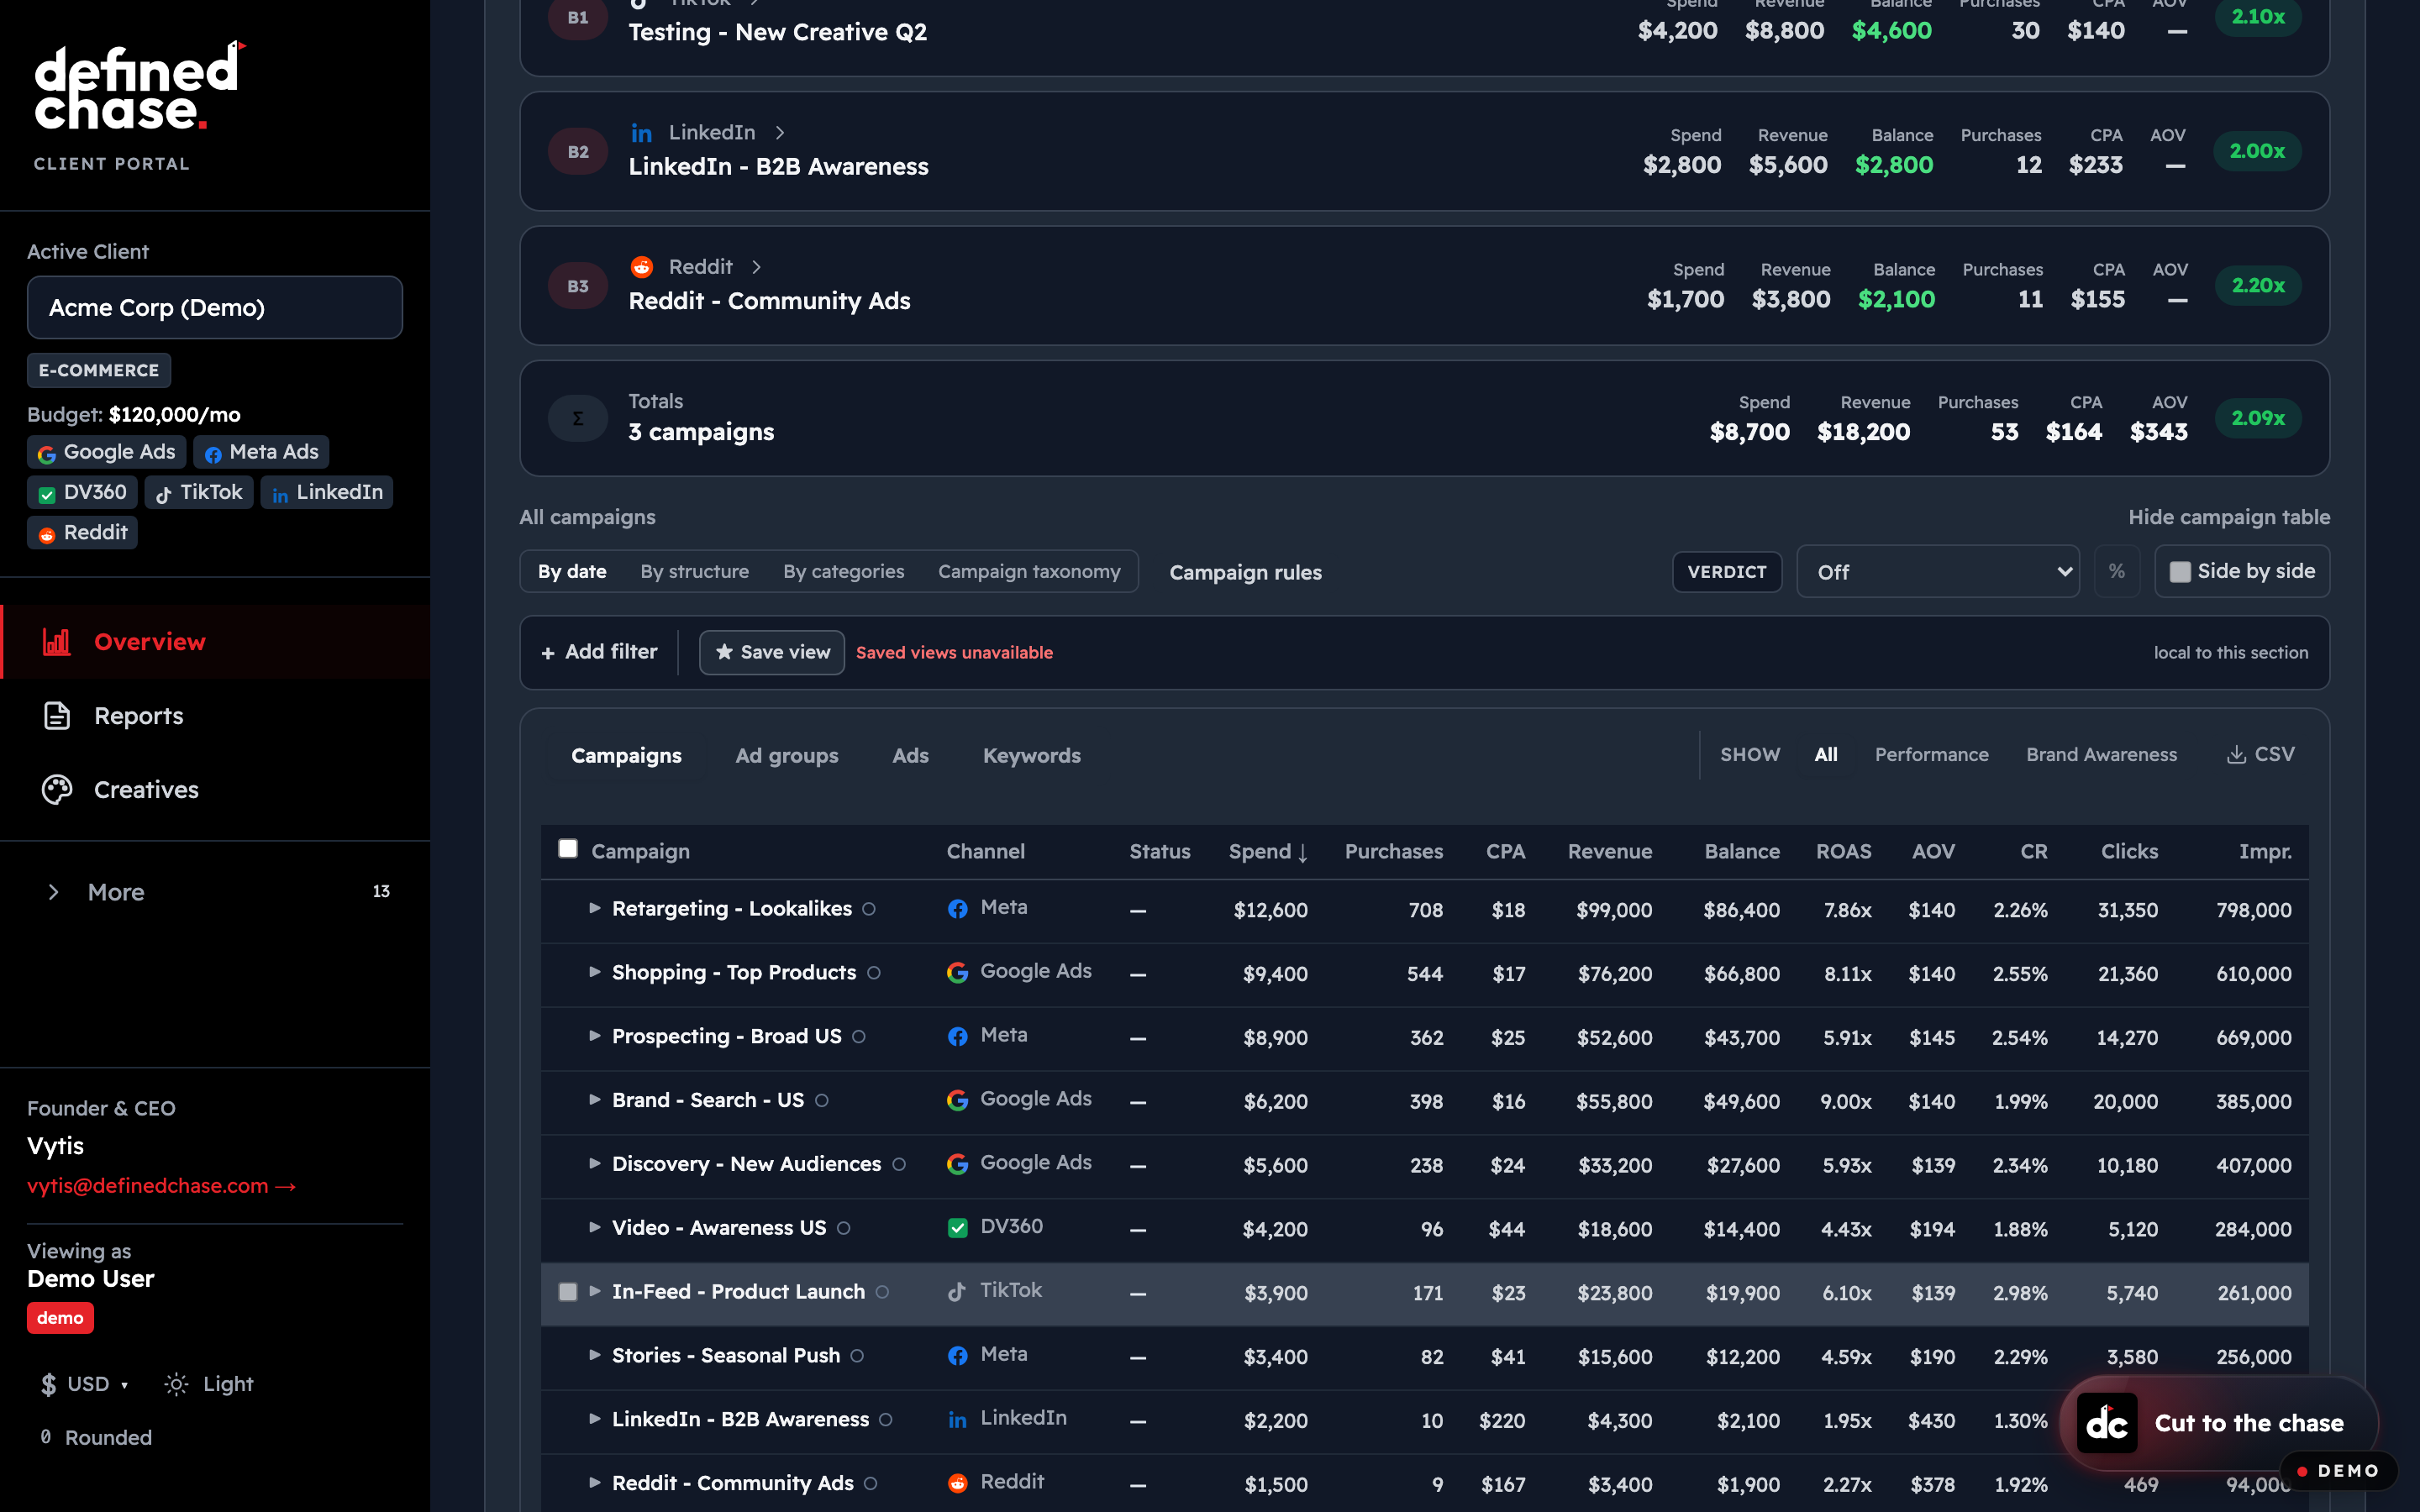
Drill from campaigns to ad groups, ads and keywords in one table — sorted by spend, with spend, purchases, CPA, revenue and ROAS side by side. Filter by channel, brand vs performance, keyword or search term, then export CSV.
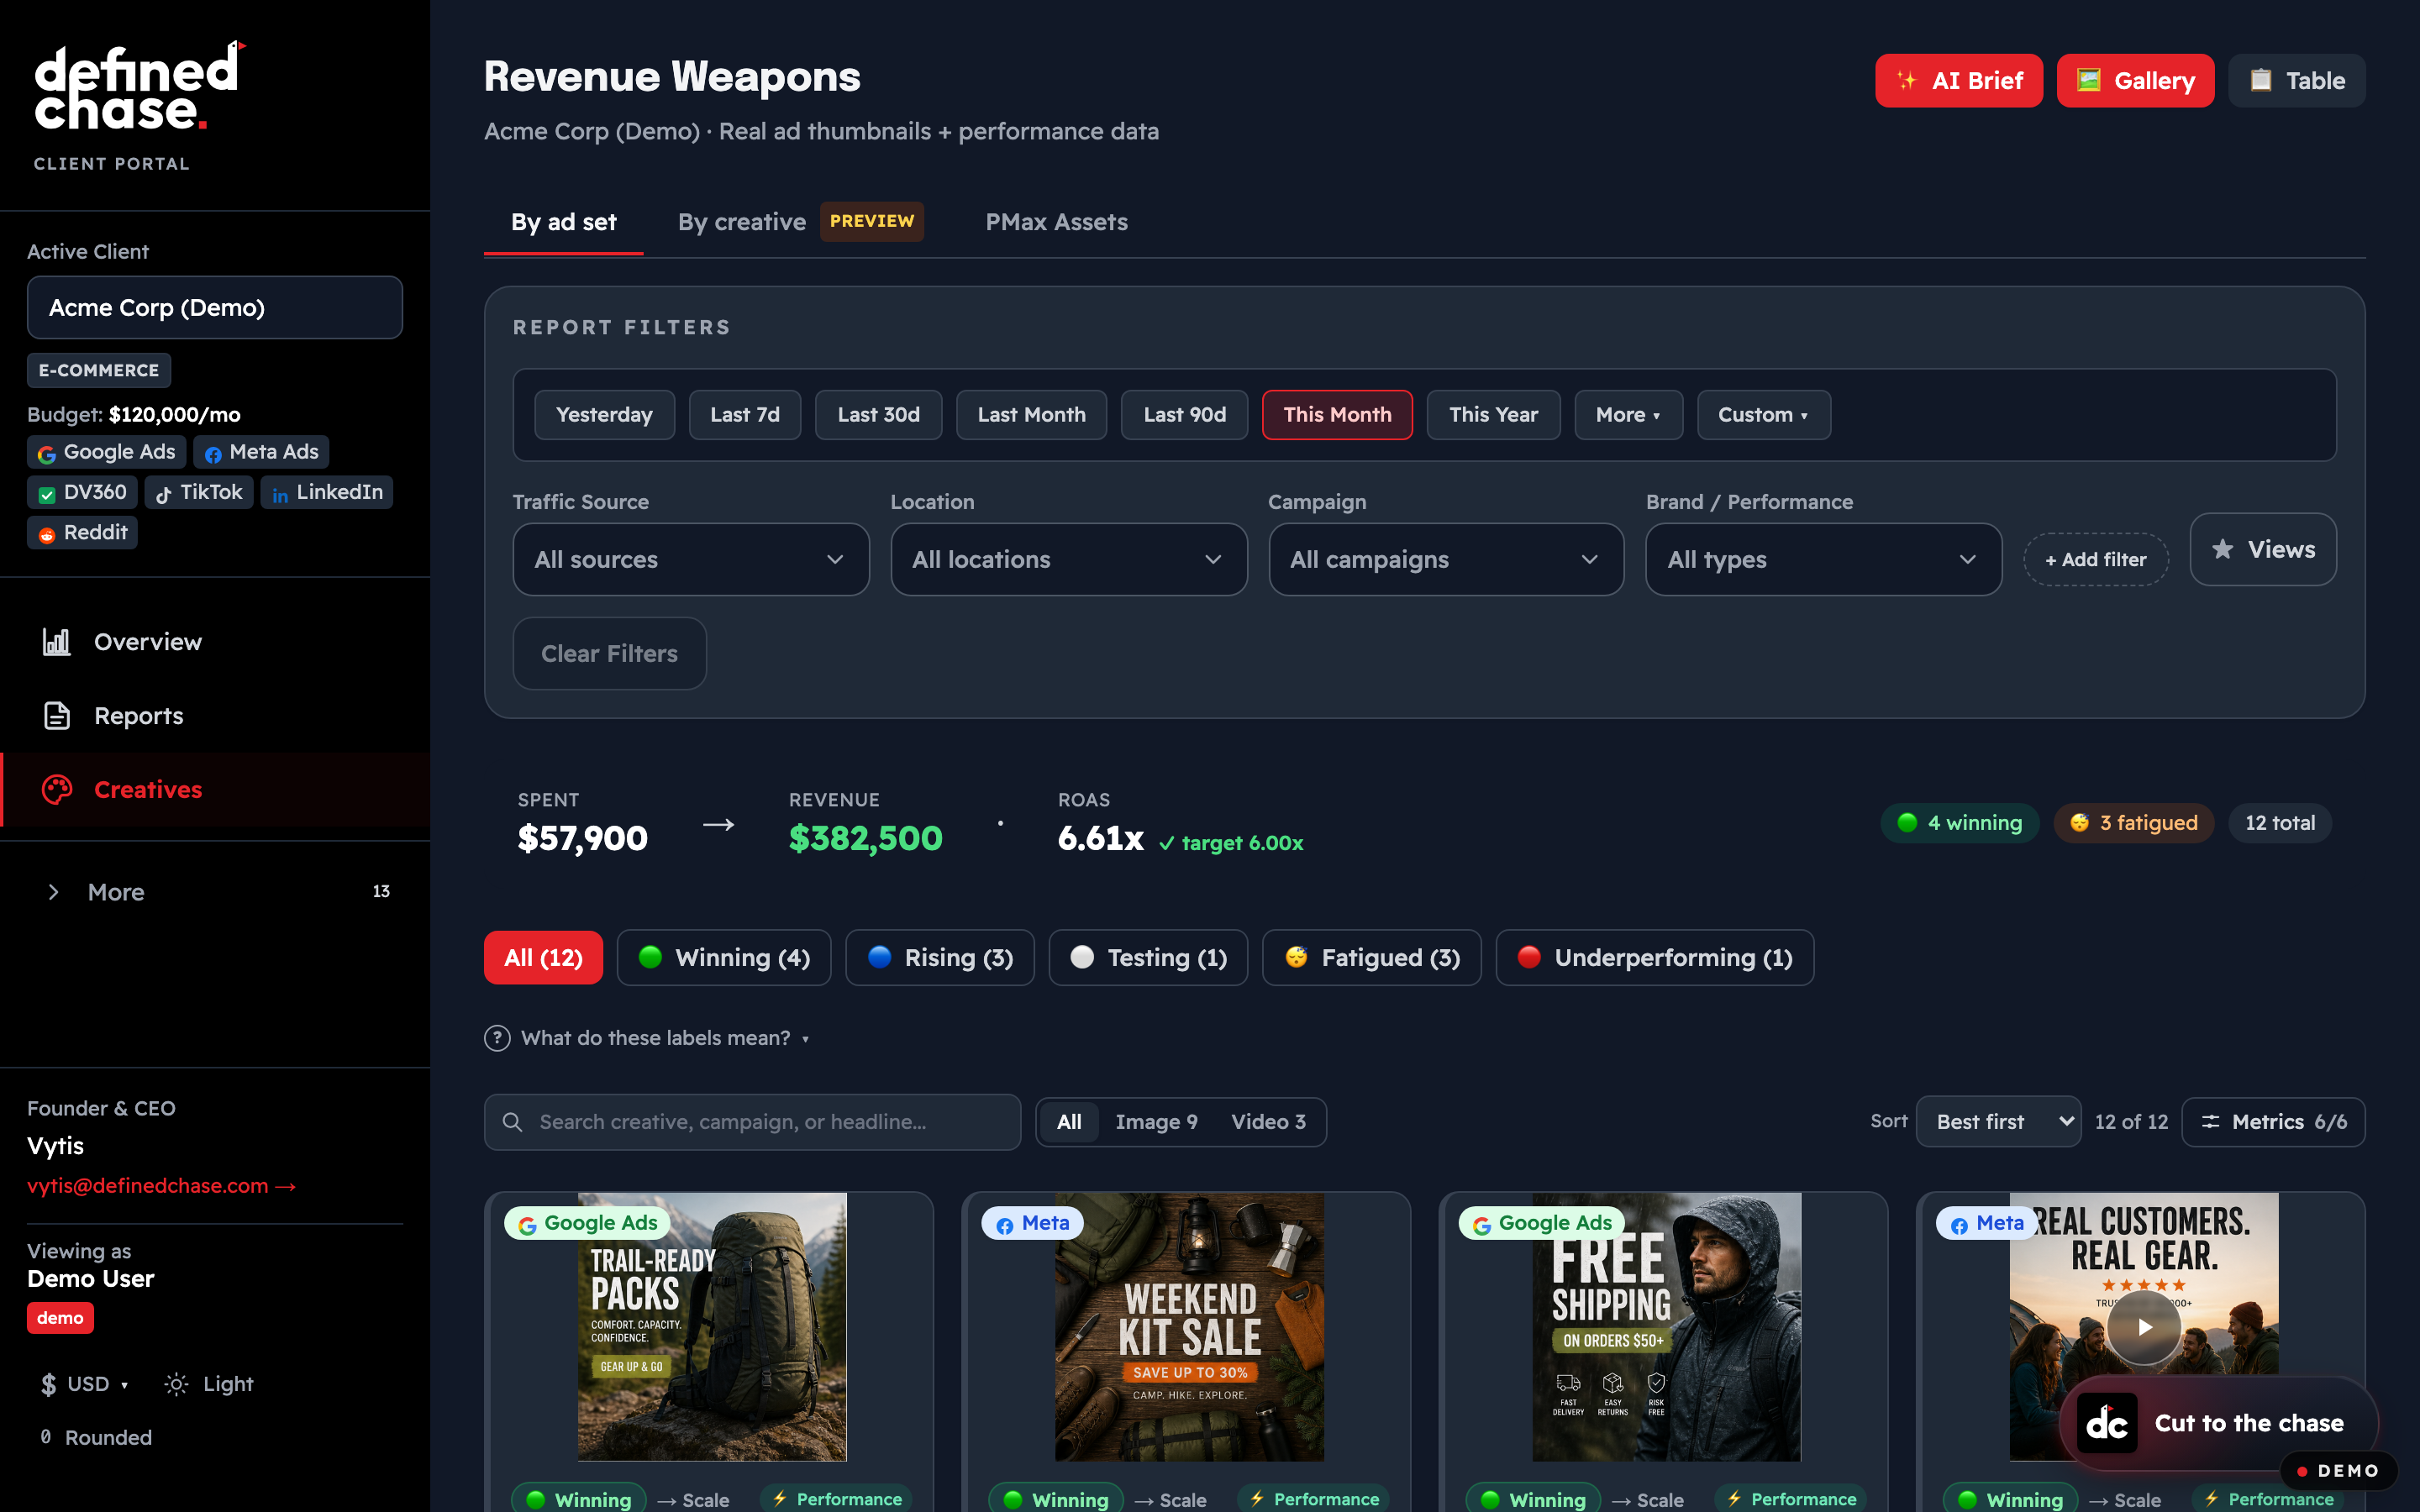
Creative thumbnails, channels, spend, ROAS, CPA and fatigue state sit next to each other, making the client conversation about what to rotate or scale much faster.
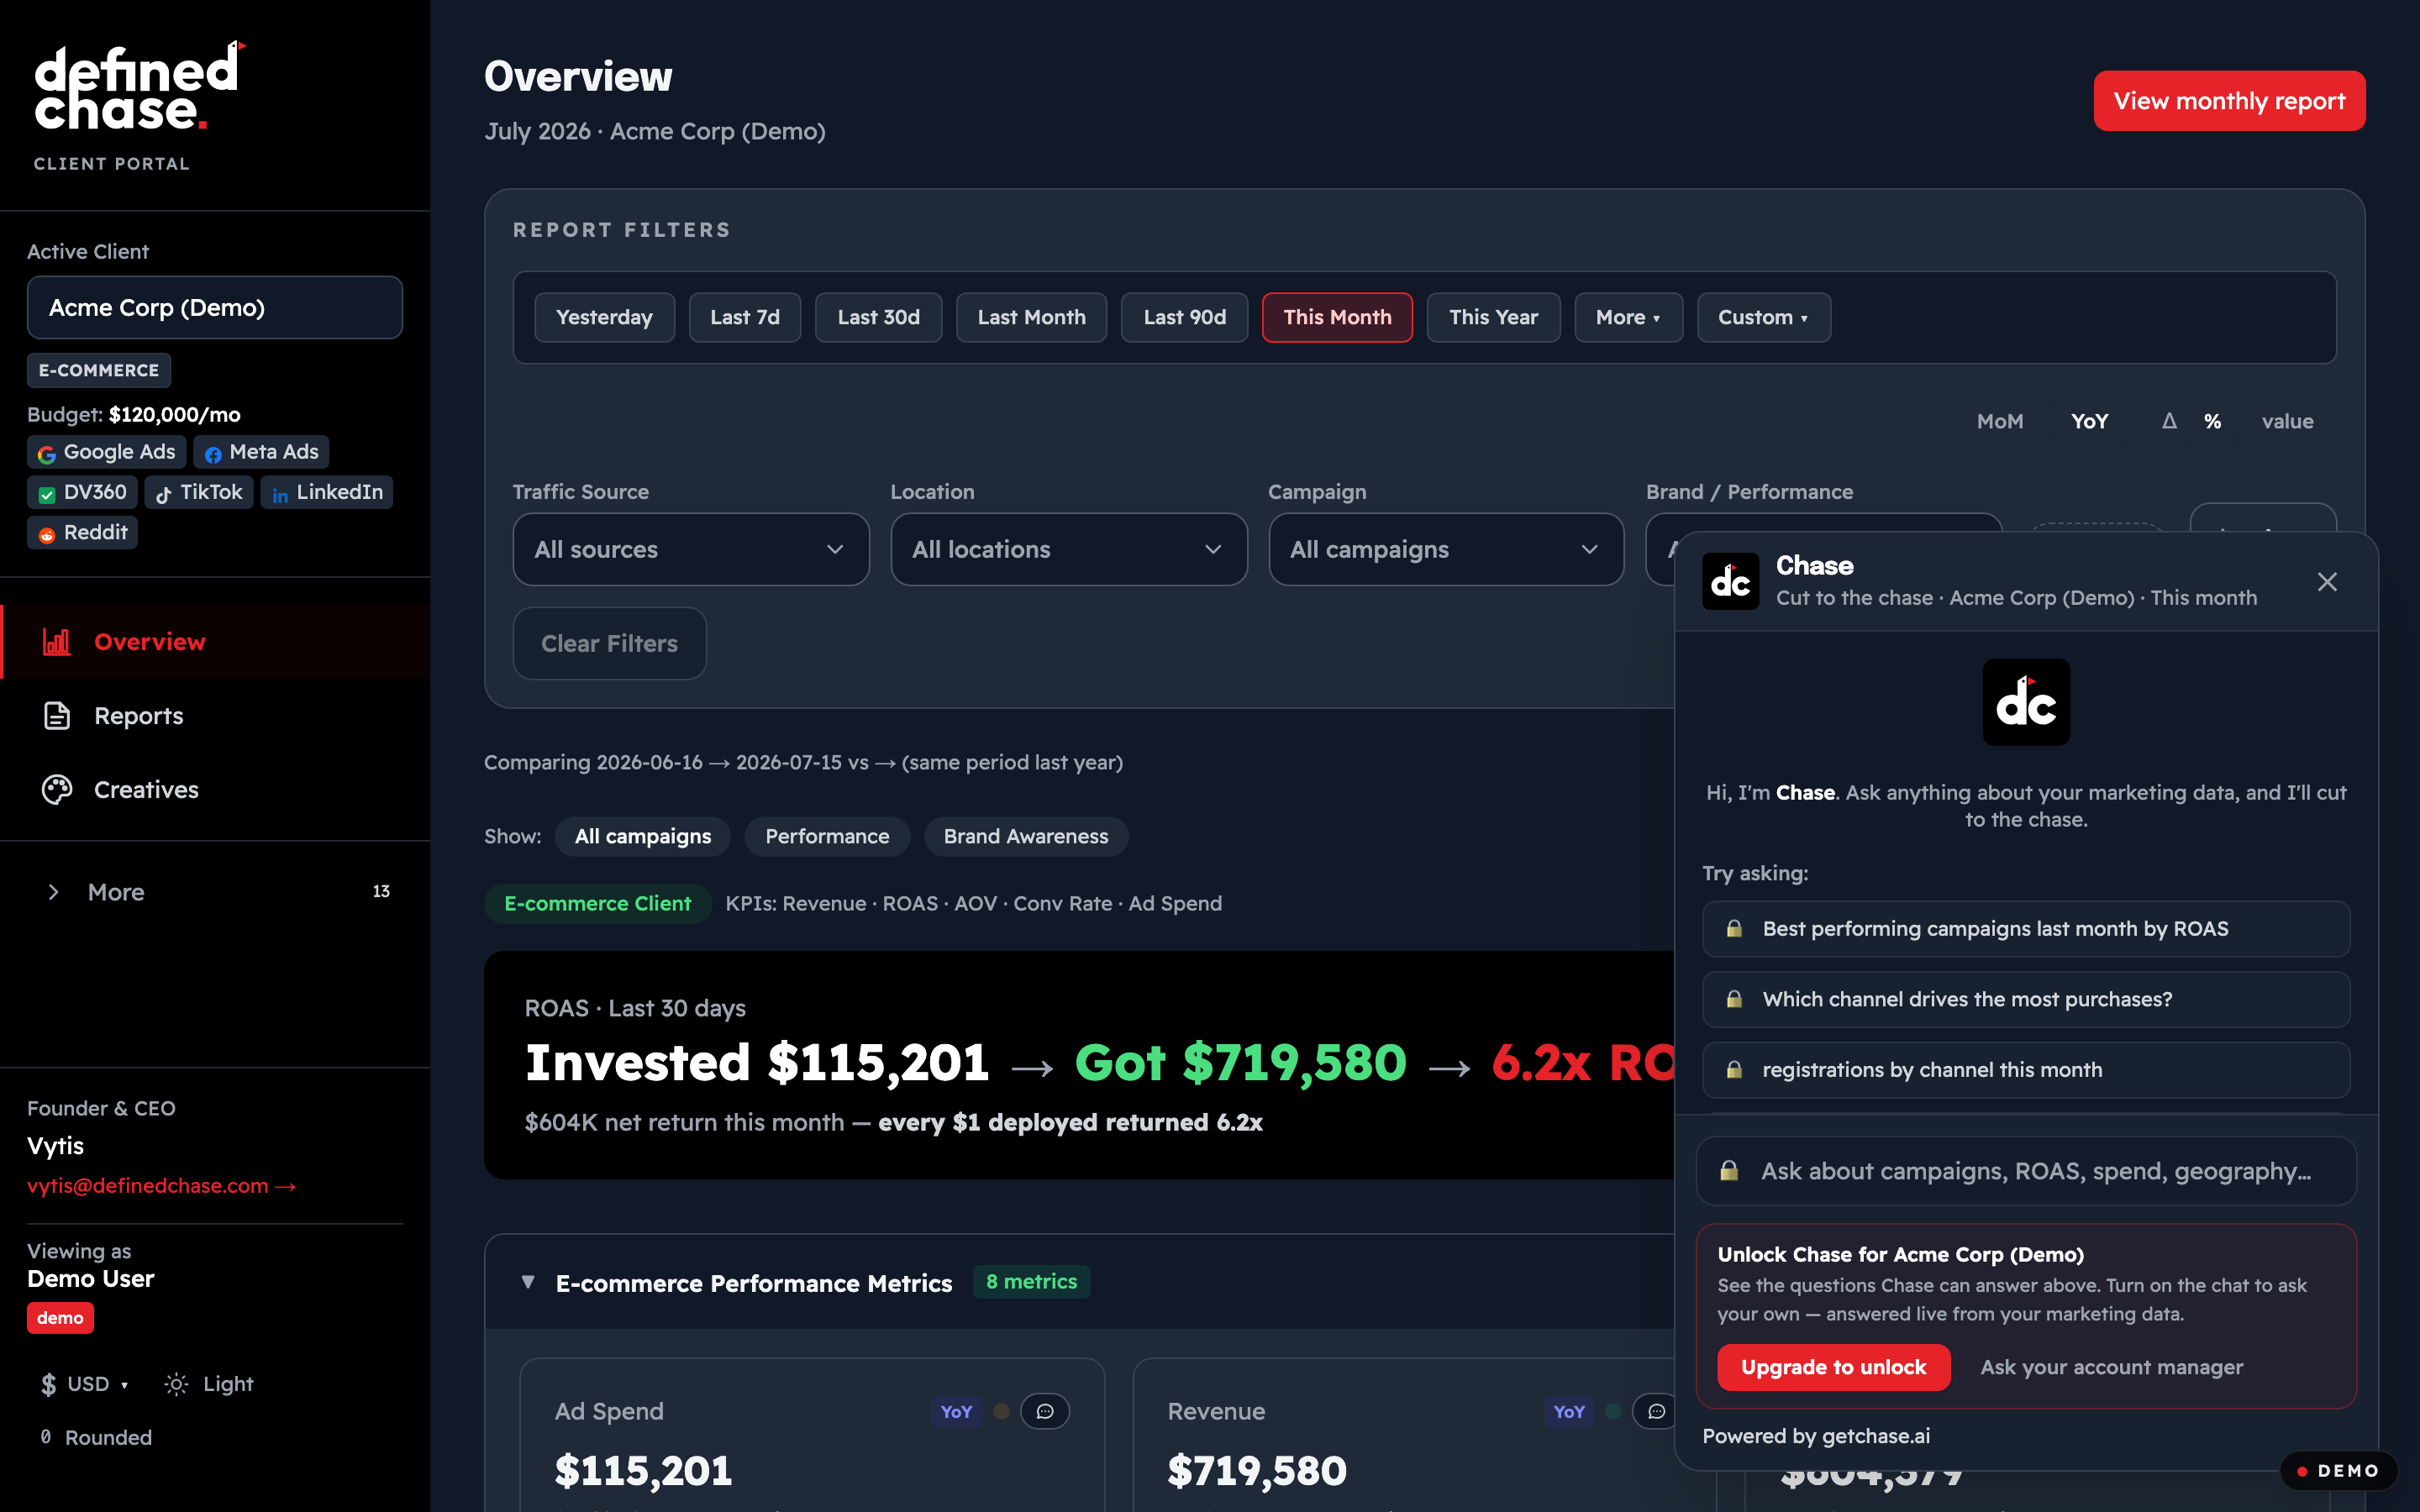
The "Cut to the chase" assistant answers plain-English questions with the numbers behind them. The MCP add-on lets Claude or ChatGPT query the same data from your own tools.
Capabilities
The portal combines daily operating data with the client-facing proof an agency needs when results, attribution or scope changes.
Google Ads, Meta, TikTok, DV360, CM360, Reddit, LinkedIn, Apple Search Ads, Bing and Twitter are pulled into one reporting layer with a shared spend, conversion and revenue contract.
Direct sync from AppsFlyer and GA4 (Web + Control) with first-open, registration and first-purchase deduplication, so app-economics numbers don't double-count between MMP and ad-platform attribution.
Brand-awareness spend is isolated from performance KPIs by default, so CPA and ROAS never get diluted by upper-funnel campaigns. Configurable per client.
Every ad creative with thumbnail, channel, spend, conversions and a fatigue score. Gallery and table views, filterable by source and brand-vs-performance.
Monthly and annual KPI targets with on-target and off-target indicators. Budget pacing shows spend trajectory against the plan agreed with the account team.
AI-flagged anomalies, persistent comment threads and a platform changelog help account managers explain what changed before the client has to ask.
Roll up a portfolio of brands (e.g. one parent with seven sub-brands) into a single grouped view with per-brand breakdown — built for holding-co and franchise marketers.
Weekly, monthly and quarterly Report Cards turn the same live portal data into point-in-time client deliverables for reviews and board updates.
Ask questions in plain English and get answers with the numbers behind them. MCP access lets Claude, ChatGPT and your own tools query your data directly — read-only, scoped to your workspace.
What changes
Connect your accounts and see spend, CAC and ROAS across Google, Meta, Reddit and more in one frame — no more stitching platform exports together.
Weekly and monthly Report Cards turn the same live data into a clean deliverable you can drop into a board deck or client update.
Creative intelligence surfaces the ads burning money and the ones worth scaling, with fatigue signals per creative.
The 30-day guarantee
Try the portal for 30 days. If you do not feel clearly more confident about what to scale, fix, or cut, email us within 30 days of purchase and we refund 100 percent of your first month.
Pricing
Self-serve. Pay, connect your accounts, and your data appears within 24–48 hours. No calls, no onboarding queue.
The client reporting portal we run our agency on — for your own team.
Cancel anytime. 30-day money-back guarantee.
Or $6,490 per year (get 2 months free).
Start 30 day risk freeAI Access add-on $299 per month — AI chat + MCP over your own data.
See everything included →Your logo, your colors, your domain. Clients log into your portal — not ours. Bring your own BigQuery.
For 3 clients, then $169 per additional client.
Unlimited users. Unlimited reports. You only pay for active client portals.
The “Cut to the chase” AI analyst is included on every client portal.
Start as an agencyAlready white-labelling the same reporting engine your clients see in this demo — under your logo.
See everything included →Prices shown in your billing currency; VAT / sales tax is added at checkout based on your billing location.
The moat
Defined Chase is a performance agency that has managed $100M+ in ad spend across Google, Meta, DV360, Reddit and more. We built this portal for ourselves first, then opened it to clients.
Specialised verticals
10+
Ecom, SaaS, leadgen, app, fintech, gaming, travel, retail, automotive, services
Service regions
4
EMEA, LATAM, North America, APAC
Reseller-approved accounts
14+
Aleph / Httpool Business Centers across Meta, TikTok and Google
Want it done for you? We also run managed media — campaign management, creative, and measurement & attribution across Google, Meta, TikTok, DV360, LinkedIn and more. Headquartered in Vilnius, Lithuania; a reseller-approved Aleph / Httpool partner.
Talk to our team about managed mediaFAQ
Google Ads, Meta, Reddit, DV360, CM360, TikTok, LinkedIn, Microsoft/Bing, Apple Search Ads and X — plus GA4 and AppsFlyer for web and app measurement. Every source is normalised into one reporting layer with a shared spend, conversion and revenue contract.
You pay, connect your own ad accounts with a few clicks, and your data appears within 24–48 hours. No calls, no onboarding queue, no analyst to schedule — it is a self-serve product.
If you barely spend on ads yet, or you want a done-for-you analyst to build bespoke dashboards rather than a self-serve product, this is probably not the right fit yet. It is built for teams spending anywhere from $10k to millions per month who want the truth in one place.
Those tools pipe raw data into dashboards you still have to build and maintain in Looker Studio or Power BI, and bill per connector, account and destination on top of the platform fee. The portal is the finished product: unified channel reporting, creative intelligence, goal pacing, publishable report cards and the AI analyst are built in — one flat price, no points to count, nothing to assemble. If you need hundreds of niche connectors for a BI warehouse, a pipeline tool is the right choice; for running and reporting paid media, this is.
A 30-day first-purchase money-back guarantee. If within 30 days of purchase you do not feel clearly more confident about what to scale, fix, or cut, email us and we refund 100 percent of your first month.
Yes. You can cancel anytime from billing and your plan stays active until the end of the period you have already paid for. There is no lock-in and no cancellation call.
Yes — the AI Access add-on ($299 per month) includes MCP, so Claude, ChatGPT and your own tools can query your reporting data directly. It is read-only and scoped to your workspace only, and it also powers the in-portal "Cut to the chase" assistant.